 |
Ecological Sustainability of Riverine Ecosystems in Central
Western Ghats
|
 |
|
Result
Spatiotemporal Land Use Analysis
The forests of Kali River Basin are acting as a rich resource base in the Western Ghats of Uttara Kannada district and supporting liveli-hood of dependent population. The land use analyses of Kali River Basin depict the spa-tiotemporal changes in the biodiversity-rich re-gion during 1973 to 2016 (Figs. 5a, b and Table 1). The classified land use information is vali-dated with field data and historical maps and overall accuracy ranges from 82.52 percent (1973), 90 percent (2016) with Kappa of 0.81 and 0.88 respectively. The evergreen forest cover has declined from 61.79 to 38.5 percent (1973-2016), due to hydroelectric, infrastructure projects and monoculture plantations (15%). The natural for-est cover is replaced with exotic species such as Acacia, Eucalyptus, and Teak etc. as part of so-cial forestry programme by the forest depart-ment. This has led to major forest cover chang-es in Dandeli, Haliyal, and parts of Supa regions. The construction of series of dams and reser-voirs has submerged large-scale pristine forest land affecting ecology. Implementation of trans-mission lines of Kaiga nuclear powerhouse has bisected contiguous pristine native forests across the basin. The land conversions that is, conversion of forest to agriculture; agriculture

Fig.4. Computation of Ecologically Sensitive Regions

Fig.5. Land use dynamics in the Kali River Basin

to coco/arecanut plantations are the major con-cerns in this region. The rehabilitation of fami-lies displaced due to river valley projects in the mid of forest regions has altered interior forests with the creation of more perforated forests with edges. The major portion of deciduous forest cover (7.82-2.24 %) in the eastern portion of the basin has been transformed to agriculture area from 9 to 17.7 percent by 2016.
Prioritisation of ESR
Ecosystem sustainability assessment is done through ESR demarcation to get a detailed picture of ecological status at village levels in the Kali River Basin considering various themes (eco-logical, social, hydrological, geo-climatic vari-ables) for conservation planning. Values of vari-ous variables (of themes) were selected based on literature reviews and field-based measurements. The land use analysis highlights (Fig. 6a) the major forest cover (> 80%) is confined to KTR region, while eastern parts are degraded due to anthropogenic pressures and the natural forest cover in this region is about 54.94 percent. The wide-scale forest clearing and subsequent agricultural expansion, exotic plantations resulted in damage of large forest patches. Unplanned implementation of the major developmental projects have disturbed the landscape with the significant erosions in the forest cover. The for-est cover weightages (Fig. 6b) illustrate higher to moderate ranking in KTR and its surround-ings. The interior forest cover is considered as another important variable, which emphasizes conservation connectivity and ecological functionalities (Fig. 6c) . The cultivation in the near-by plots and roads have influenced the natural
cover. The presence of large number of edges and perforated patches reveal loss of connec-tivity and contiguous forest patches. The high-er interior forest can be seen in grids of Supa taluk (Fig. 6d). The plains (Haliyal, Hubli, Bel-gaum portions) are with the least weightages (1,
3) due to more disturbed forest cover with least or no interior forest cover.
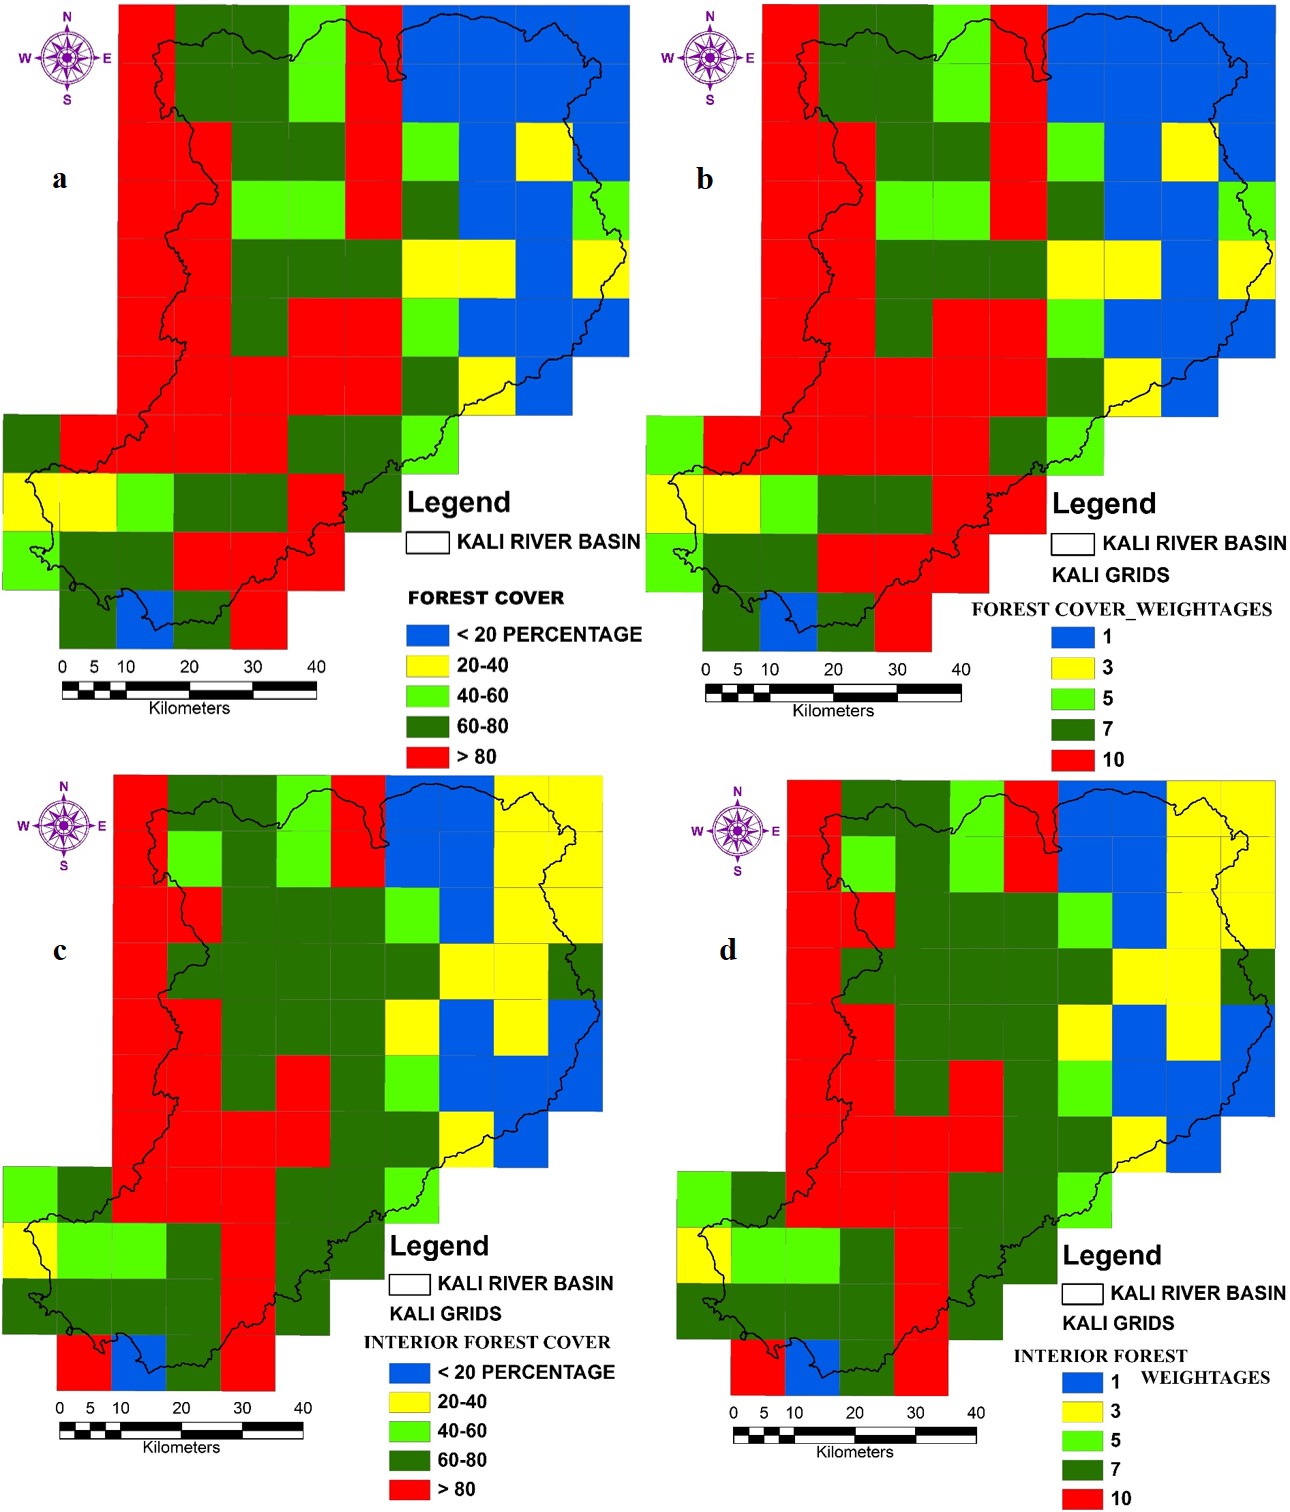
Fig. 6. Forest cover, Interior forest cover with their relative weightages
The ecology of Kali basin was assessed through assessment of biodiversity such as endemic flora, fauna, the biomass of forests, the status of conservation reserves etc. These information was compiled from literature review as well as field-based measurements. Field data was collected using pre-calibrated GPS (Global Positioning System), which provided coordinates of the location - latitude, longitude and altitude. This information was plotted to under-stand the spatial patterns of distribution and the respective habitats. Figure 7a, b gives the spatial distribution of endemic flora with its weightages. The region is home to very rare and endangered fauna (Fig. 7c). Main carnivores are tiger (Panthera tigris), leopard, wild dog (dhole) and sloth bear. Leopards are in good number and wild dogs are in very less number, usually sight-ed in Kulgi and Phansoli ranges of Dandeli. Sloth bears are in very good number and these are frequently sighted in Ambikanagar, Virnoli, Bhagavati. Prey animals are barking deer, spot-ted deer (Axis axis), wild boar, sambar (Cervus unicolor), gaur (Bos gaurus). The region is part of an important elephant corridor between Kar-nataka and Maharashtra with at least 47 ele-phants which are frequently sighted near Sam-brani, Bommanahalli dam backwaters. These re-gions are habitats for Malabar Giant Squirrel, Slender Loris, etc. Some of the important birds are Malabar Trogon, Malabar Pied Hornbill, Malabar Grey Hornbill, Indian Grey Hornbill, Great Indian Hornbill, Emerald Dove, Ceylon Frog mouth, Pompador Pigeon etc. Kali River accommodates at least 200+ marsh crocodiles and a good number of these can be sighted near Dandelappa temple in Dandeli town. Another rare reptile found is Draco (Flying Lizard) which can be easily sighted near Mandurli IB, Anshi Nature Camp, Sathkhand falls. There are diverse variety of snakes that is, King Cobra, Cobra, Malabar Pit Viper, Hump nosed pit Viper, Bam-boo Pit Viper, Kraft, Ornate flying snake, wolf snake etc. the region has a wide variety of but-terflies - Crimson Rose, Common Rose, Leaf, Clip-per, Tigers, Southern Bird wing, Cruiser etc. High-er weights (10) are assigned to the grids (Fig. 7d) covering all endemic species and grids with non-endemic fauna were assigned 3.
Biomass is a significant variable in the analysis from carbon sequestration perspective and the role of forests in the mitigation of global warming. Earlier data (Ramachandra et al. 2013) was considered to assess the extent and quan-tum of biomass. The analysis was based on total standing biomass of forest’s vegetation (Brown 1997; Ramachandra et al. 2000) and field data with
the remote sensing data. The field transacts wise basal area were estimated, which was used to quantify standing biomass using allometric equations. The basal area computed using regression equations was validated through comparison with data based on field estimations. The standing biomass in each grid is estimated based on the spatial extent of forests (Fig.7e) . The forests in the Supa region have higher biomass (>1200 Gg) and eastern part are with deciduous to dry deciduous forests of Haliyal region and have lower biomass (< 200 Gg). The higher bio-mass regions are assigned greater weightages and vice versa (Fig. 7f). Net carbon storage in the forests is estimated as half of the biomass as per the standard protocol of published litera-tures (Brown 1997; Ramachandra et al. 2000). The study highlights that these regions are car-bon repositories and degrading or disturbing these regions would result in higher carbon emis-sions and the loss of carbon sequestration po-tential. Hence the grids with higher carbon se-questration potential were assigned higher con-servation values (Fig. 7g, h). Higher weights (Fig. 7i, j) were assigned to the protected area – KTR, as it is aiding in the conservation of keystone species and rice biodiversity.
Geo-climatic data were analyzed by considering altitude, slope, and rainfall. The high altitude regions are prone to landslides due to heavy rain and extreme weather conditions. The Figure 8a shows the altitude of the district, high-est elevation is 1758 m in Supa taluk. The weight-age map is generated by considering > 600 m as a higher priority for conservation and > 400 m is moderate and rest are of least concern (Fig. 8b). Slope map (Fig. 8c) is generated to identify the regions which are more sensitive; alteration of these regions will have a higher impact. In such areas, landscape disturbances will lead to soil erosion, landslides, secondary plant succession, and ultimately to land abandonment. The slope
> 12 degrees is considered as a more sensitive region and assigned higher weightage (Fig. 8d). The rainfall pattern of the district is analyzed to mark the sensitive regions for conservation. Most of the KTR region (Fig. 8e) is in the high rainfall zone, except eastern parts of Haliyal. The endemic species are well distributed in high rain-fall regions. The data analyses reveal that diver-sity, endemism, and rainfall are correlated. Figure 8f reflects weightages considering rainfall gradients.
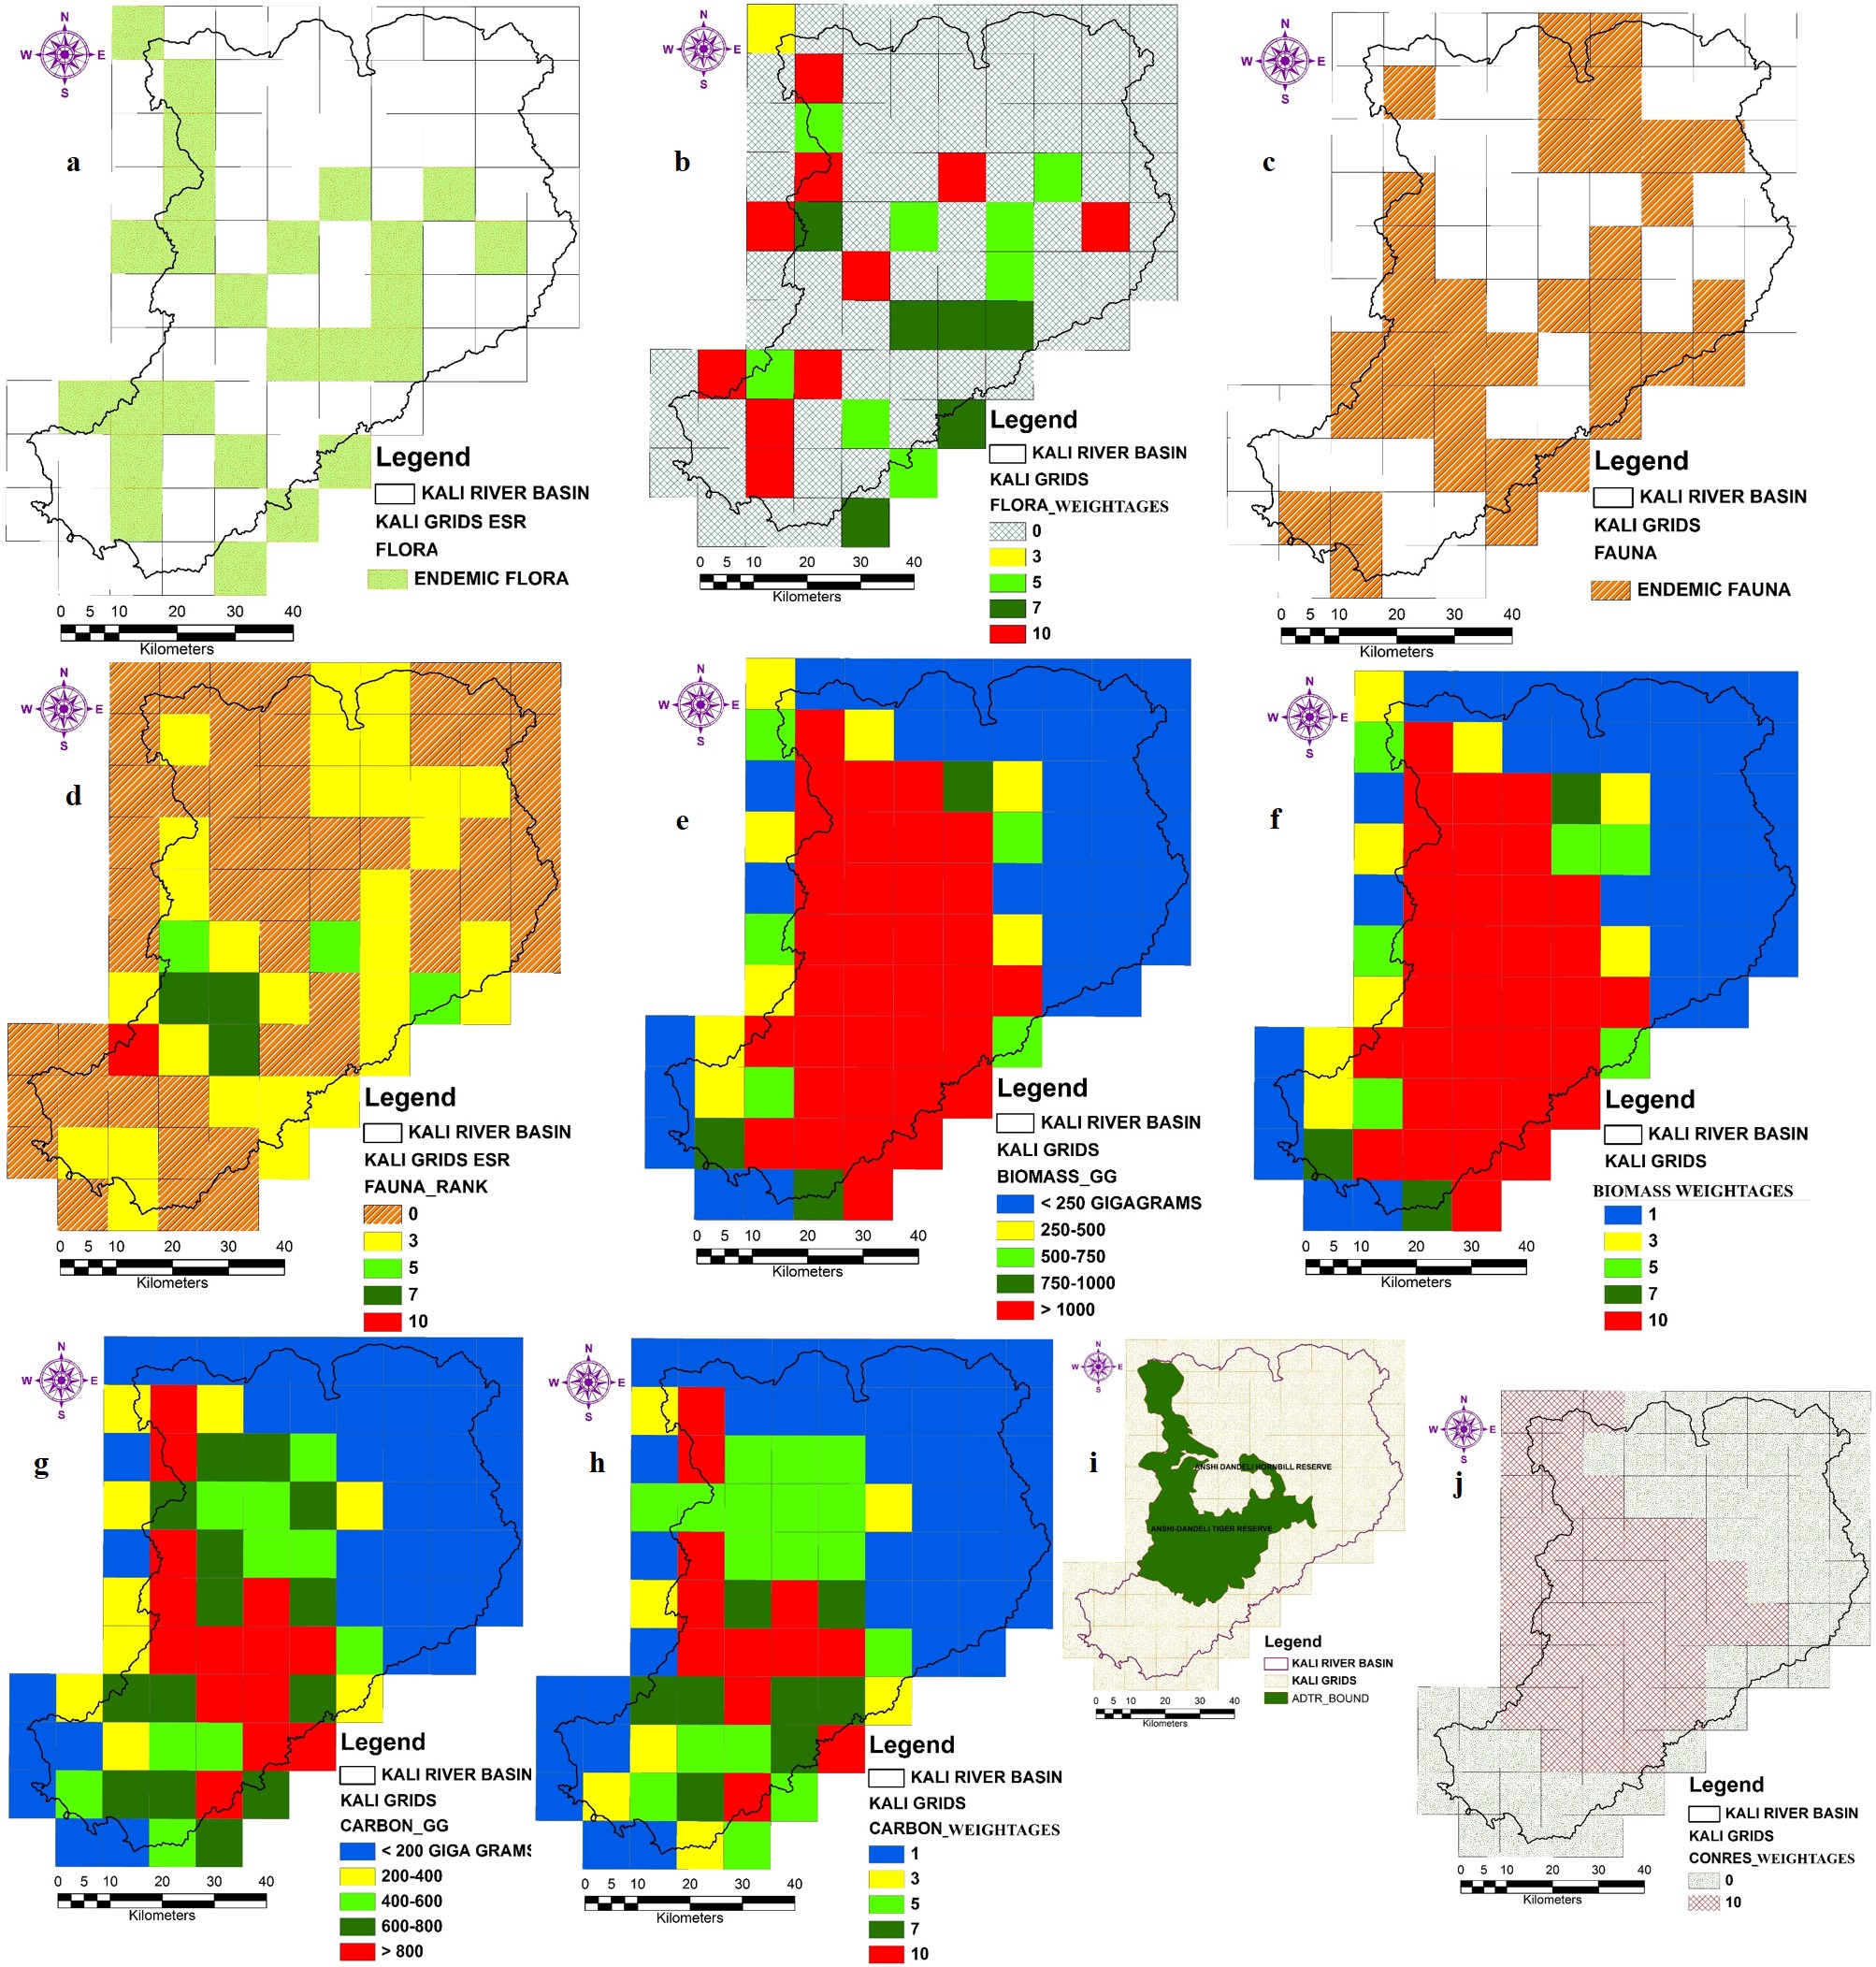
Fig. 7. Ecology variables with their ranking based on their weights
Hydrology is analyzed sub-basin wise by monitoring select streams to understand the factors responsible for perennial and seasonal flows of the region. The presence of perennial streams in the catchment dominated by native vegetation compared to seasonal streams with catchment dominated by degraded landscape or of monoculture plantations. Majority of streams in the region are perennial that reflects the health of the ecosystem. The Figure. 8g shows the
stream flow at each grid of the district. The KTR, Supa region shows water availability of 12 months in the streams and Figure 8h reflects the relative weightages.

Fig. 8. Geo-climatic variables and their weightages
Environmentally sound alternative sources of energy are considered for prioritization. Solar, Wind, Bioenergy data sets are collected and analyzed and weightages assigned (Fig. 9a, b, c, d). The entire region receives an average solar insolation of 5.42 kWh/m2/day annually and has
more than 300 clear sunny days. This solar po-tential is utilized to meet the domestic and irriga-tion electricity demand. Domestic demand of the household in a rural region is about 50 to 100 kWh per month. The solar potential assessment reveals that domestic demand can be supplied by installing rooftop SPV modules since less the 5 percent of the rooftop is required in the majority of the houses and irrigation demand can be met by installing PV modules in a waste-land where less than 3 percent of available waste-land area is sufficient. Bioresource availability is computed based on the compilation of data on the area and productivity of agriculture and horticulture crops, forests and plantations. Sec-tor-wise energy demand is computed based on the National Sample Survey Organization (NSSO study) data, primary survey data and from the literature. The supply/demand ratio in the district ranges from less than 0.5 to more the 2. If the ratio is less than 1 (demand >supply), then reflects of fuelwood deficit status and the ratio of more than 1 (supply>demand) reflects fuel-wood surplus situation. Wind resource assessment shows Wind speed varies from 1.9 m/s (6.84 km/hr.) to 3.93 m/s (14.15 km/hr.) throughout the year with a minimum in October and maximum in June and July. Hybridizing wind energy systems with other locally available resources (solar,
bioenergy) would assure the reliable energy supply to meet the energy demand at decentralized levels.
The forest-dwelling communities of the region are considered for prioritization (as per For-est Dwellers Act 2005 or Forests Rights Act 2005). These communities depend directly and indirectly on forest resources for their livelihood. The forest-dwelling communities are Kunbis, Siddis, Goulis, Gondas. They are socially and politically backward and most of them depend on casual labor, trading forest products for their livelihood. The grids with the presence of tribes were assigned higher weightages (Fig. 10a, b). Population density is considered as another proxy for ESR mapping. The population density of each grid is analyzed (Fig. 10c) and estimated for 2016 based on population census data of 2011. It is evident that with higher population, resource extraction is higher (Fig. 10d). The grids with the higher population density were assigned lower weights of 1 and lower density regions were assigned weights of 10.
Estuarine ecosystems are a tiny ribbon of land, but the emissions from their destruction are nearly one-fifth of those attributed to defor-estation worldwide (Pendelton et al. 2012). The major mangrove species present are Rhizopho-ra mucronata, Sonneratia alba, Avicennia marina, Avicennia officinalis, Kandelia candel, Rhizophora apiculata, Sonneratia caseolaris. The farmers also plant rows of mangrove trees just outside these bunds to fortify them from collapse. This traditional system of estuarine cultivation with mangrove planting was a sus-tainable system. Kali River has major dams with hydropower stations have affected mangroves, fish yield, and other goods. The weightages are assigned as per the data analyzed emphasizing productivity (Fig. 10e).
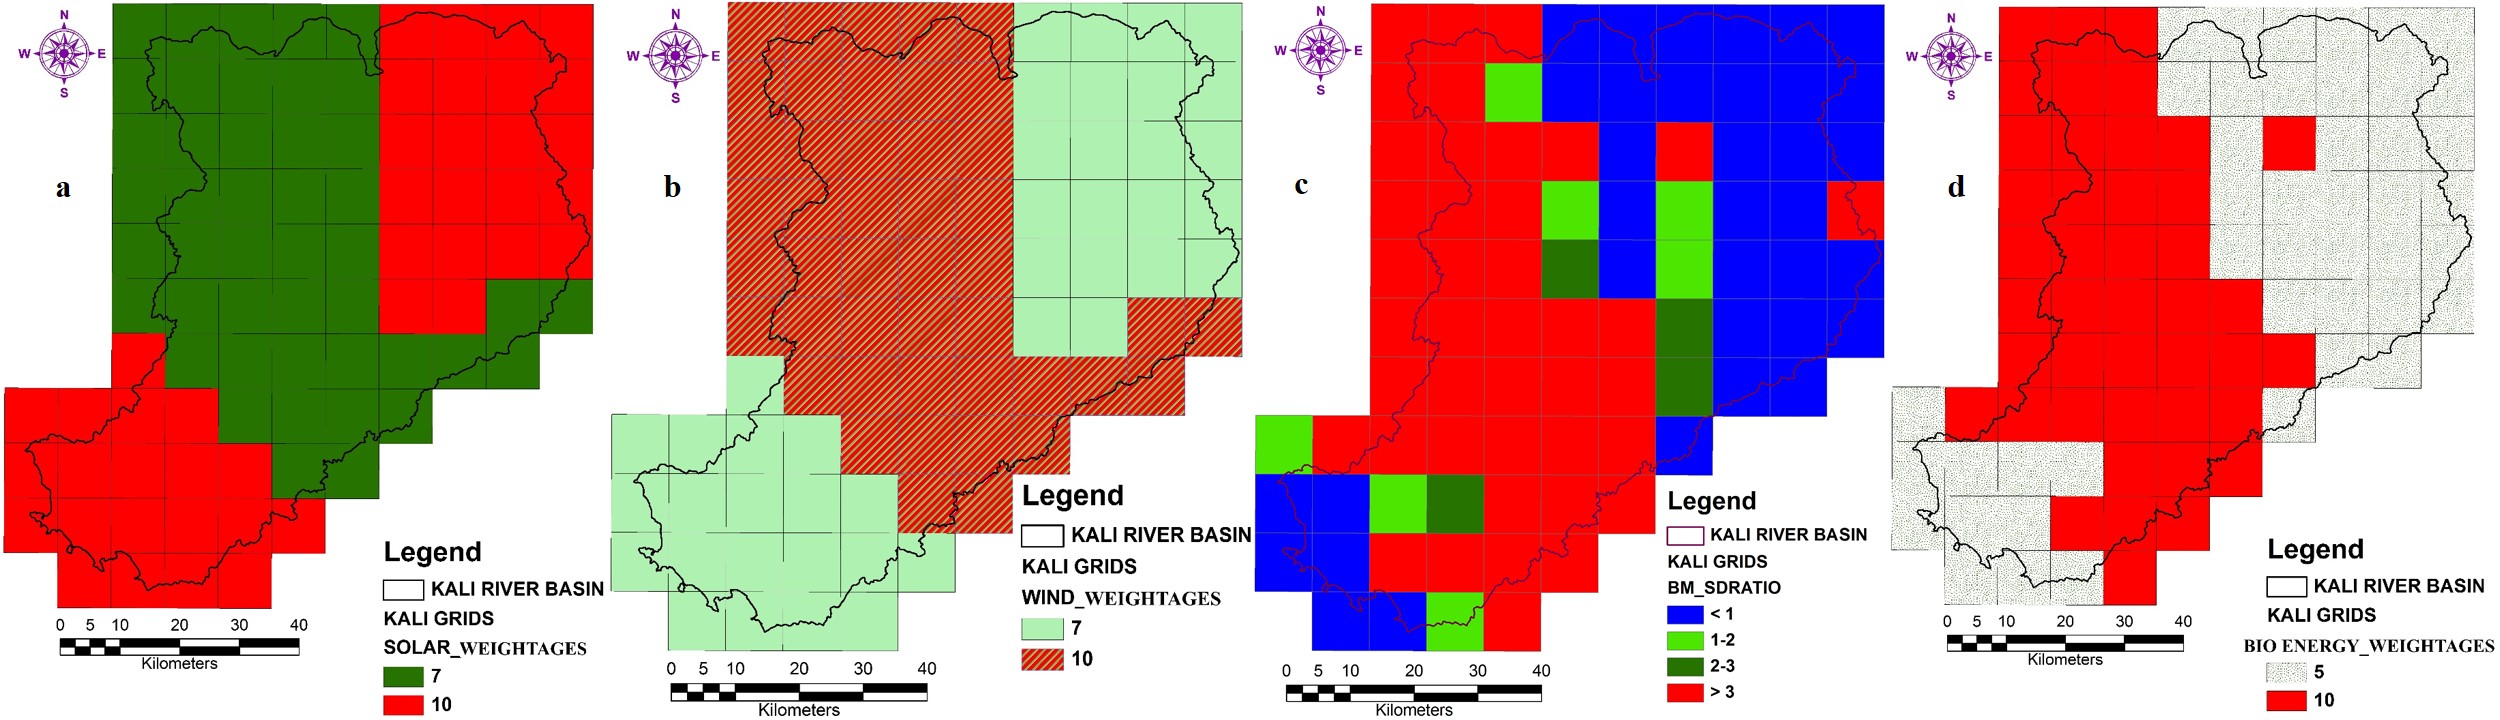
Fig. 9. Energy theme variables and weightages

Fig. 10. Socio aspects and esturine diversity variables and their weightages
The aggregation of all metrics for each grid and intergrid analyses aided in prioritizing eco-logically sensitive regions (ESR) based on the relative weights and grids are prioritized as ESR 1, 2, 3 and 4. Figure 11a shows 47 grids represent ESR 1, 9 grids represent ESR 2, 8 grids represent ESR 3 and the rest 23 grids represent ESR 4. The 54 percent of the grids represents ESR 1, 10.34 percent of the area shows ESR 2, 9.19 percent of the area shows ESR 3 and only 26.44 percent area covers ESR 4. Figure 11a and Table 5 shows village level ecological sensitive regions. ESR 1 represents zone of highest conservation, no fur-ther degradation allowed. ESR 1 can be treated as a high sensitive region of the district and more conservation is to be imposed by regula-tory authorities as well as through VFCs (Village forest committees). ESR 2 represents a zone of higher conservation and forms a transition for highest conservation and moderate conserva-tion regions. ESR 3 represents moderate conser-vation region and only regulated development is allowed in these areas. ESR 4 represents least
diversity areas and the developments are allowed as per the requirement by strict vigilance from regulatory authorities. It is recommended that these regions also has a scope for further en-richment / improvement of environment through the involvement of local stakeholders by the forest department. In ESR 3, further developments are allowed only with the critical review from regulatory authorities in consultations with the local stakeholders. Small -scale tourism should be encouraged adopting benefit sharing with local communities such as homestay, spice farms, eco-friendly boating etc. The uncontrolled and unplanned development should be discour-aged in and around of pristine lakes, primeval forest patches, perennial water bodies. The site-specific (clustered base) sustainable develop-ments can be taken up at each panchayat, which has least effect on the ecosystem. The forest department should refrain from raising monoc-ulture plantations and replace existing exotics in the stages (phased manner) with endemic spe-cies. Promote decentralized electricity, use of renewable energy sources such as (solar, wind, bioenergy, etc.). The region should promote agro processing industries to synthesize local re-sources while providing employment. Adapt only environmentally sound development projects and implementation by involving local community in decision making, social impact assessment and post-project environmental monitoring. No new major roads, widening of existing roads, railway lines are allowed, except when highly essential and subject to EIA, by imposing strict regulation and social audit. Tour-ism Master Plan should be based on MOEF reg-ulations (after taking into account social and en-vironmental costs). Controlled activities are allowed based on socio-economic importance, while activ-ities leading to degradation of wetlands, natural forests or introduction of alien invasive species are prohibited in eco-sensitive regions.
Kali River Basin is spread across three dis-tricts with 524 villages (Table 2) and Figure 11b prioritises these villages as ESR 1 to ESR 4 based on the eco-sensitiveness. Forests of these villages need to be protected. Table 3 provides the details of the prohibited and regulated activities depending on eco-sensitiveness in each ESR region.
KTR region is a sensitive habitat for wild flora and fauna. As per Wildlife Conservation Strategy 2002, Union government had stipulat-ed a 10 km buffer region as eco fragile zones (Eco-Sensitive Zones) around protected areas / national parks under Environmental (Protection) Act, 1986. Eco-Sensitive Zones are specified as transition zones around protected forest areas, that would minimize forest depletion and human-animal conflicts. These are intended to provide habitat improvement, enhance the environmen-tal services, reduce edge effects, connectivity, reducing fragmentation of forests and also pro-vides a physical barrier from human encroach-ments. Eco-Sensitive Zones are areas adjacent to protected areas/ national parks, on which land use is partially restricted to give an added layer of protection while providing valued benefits to neighboring rural communities. However, in re-cent times, the vested interests are pushing many projects under the guise of drinking water scheme and ecotourism projects, etc. to push consultant driven environmentally sound projects with the nexus of contractors and inefficient bureaucrats. The Ministry of Environment, Forests and Cli-mate Change (MoEFCC) has approved a reduc-tion of Eco-Sensitive Zones (from 10 km to 100m) by a series of notifications in the numerous na-tional parks and wildlife sanctuaries. Honorable Supreme Court while taking serious objections to these unscientific reductions (driven by politi-cal), has directed that a 10-km limit as the Eco-Sensitive Zones. The guidelines for Eco -Sensi-tive Zones proposed that the boundary had to be site-specific, decided in consultation with a field-based team comprising representatives from the forest department, revenue department and Panchayat Raj institution. The purpose of delineating Eco-Sensitive Zones is to sustain the natural resources to support the livelihood of people. The approach adopts people inclu-sive path and ensures a legal framework to support conservation of ecologically sensitive hab-itats to restrict further degradation of forests.


 In the case of KTR, there is a serious move of reducing its Eco- Sensitive Zone (reduction of the area by 75%) to 100 m and reduction of spatial extent of the reserve by 30 percent. These eco-sensitive region (KTR with 10 km buffer) covers 155 villages, of which 97 falls in ESR-1, 26 falls under ESR-2 and 28, 4 falls under ESR-3, 4 respectively (Fig. 12a, b). KTR has 87 villages under ESR-1. These eco-sensitive regions need
to be enriched with native species to reduce fur-ther degradation. The federal government should focus on sustainable management of eco-sensi-tive regions to sustain natural resources (water, food, fodder, etc.) and support people’s liveli-hood than de- notifying region, which deprives the local biota their right to life.
In the case of KTR, there is a serious move of reducing its Eco- Sensitive Zone (reduction of the area by 75%) to 100 m and reduction of spatial extent of the reserve by 30 percent. These eco-sensitive region (KTR with 10 km buffer) covers 155 villages, of which 97 falls in ESR-1, 26 falls under ESR-2 and 28, 4 falls under ESR-3, 4 respectively (Fig. 12a, b). KTR has 87 villages under ESR-1. These eco-sensitive regions need
to be enriched with native species to reduce fur-ther degradation. The federal government should focus on sustainable management of eco-sensi-tive regions to sustain natural resources (water, food, fodder, etc.) and support people’s liveli-hood than de- notifying region, which deprives the local biota their right to life.
|
|
Citation :T. V. Ramachandra, Bharath Setturu, S. Vinay, 2018. Ecological Sustainability of Riverine Ecosystems in Central Western Ghats. J Biodiversity, 9(1-2): 25-42 (2018) DOI: 11.258359/KRE-159
| * Corresponding Author : |
|
Dr. T.V. Ramachandra
Energy & Wetlands Research Group, Centre for Ecological Sciences, Indian Institute of Science, Bangalore – 560 012, India.
Tel : +91-80-2293 3099/2293 3503 [extn - 107],
Fax : 91-80-23601428 / 23600085 / 23600683 [CES-TVR]
E-mail : tvr@iisc.ac.in, energy.ces@iisc.ac.in,
Web : http://wgbis.ces.iisc.ac.in/energy/
|
|